
Estate Manager
The Energy Solution integrates data and reporting from current Monthly consumption and data report spreadsheet into the iSite system. The idea is that with systematising the raw data, an organisation's current process can reduce reporting resource time significantly, as well as is more flexible that any current spreadsheet. The reporting can be defined by the user by accessing a rich source of energy data, allowing flexibility and value added functionality. This also enhances the single version of the truth for property data.
Console
This is the Energy Console that provides on demand reports and comparisons.

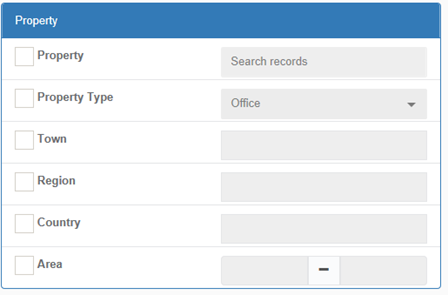
The user can apply filter options to run a search based on:
- Region
- Area
- Property Type (Retail & Admin & Data)
- Property Group
- Cluster
- Property
- Properties by m2
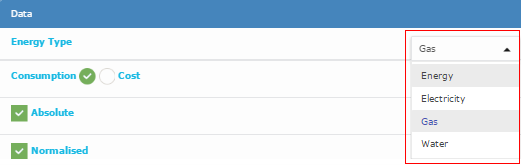
Apply Energy Type options to run search on:
- Energy
- Gas
- Electricity
- Water
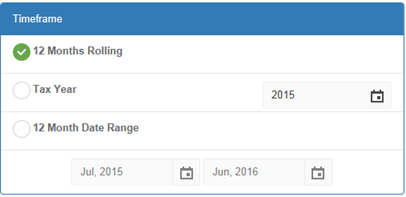
Apply Time frame options to run search on:
- Tax Year
- 12 months rolling
- 12 date range
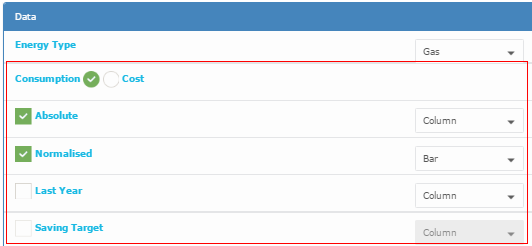
Apply Data options to run a search on:
- Absolute Consumption (bar or line)
- Normalised Consumption (bar or line)
- Cost Calculated (bar or line)
- Cost Normalised (bar or line)
- Last year overlaid (line)
- Cost Target overlaid (line)
Apply Display Options to view in:
- Graph or,
- Table

Every time the user runs a report a tile is being produced displaying the filter options selected. And this happens as many times and options are being requested form the user, consequently having several reports to compare to.
Ways to apply a Comparison on:
- Filter
- Timeframe
- Data
- Display
- Energy Type
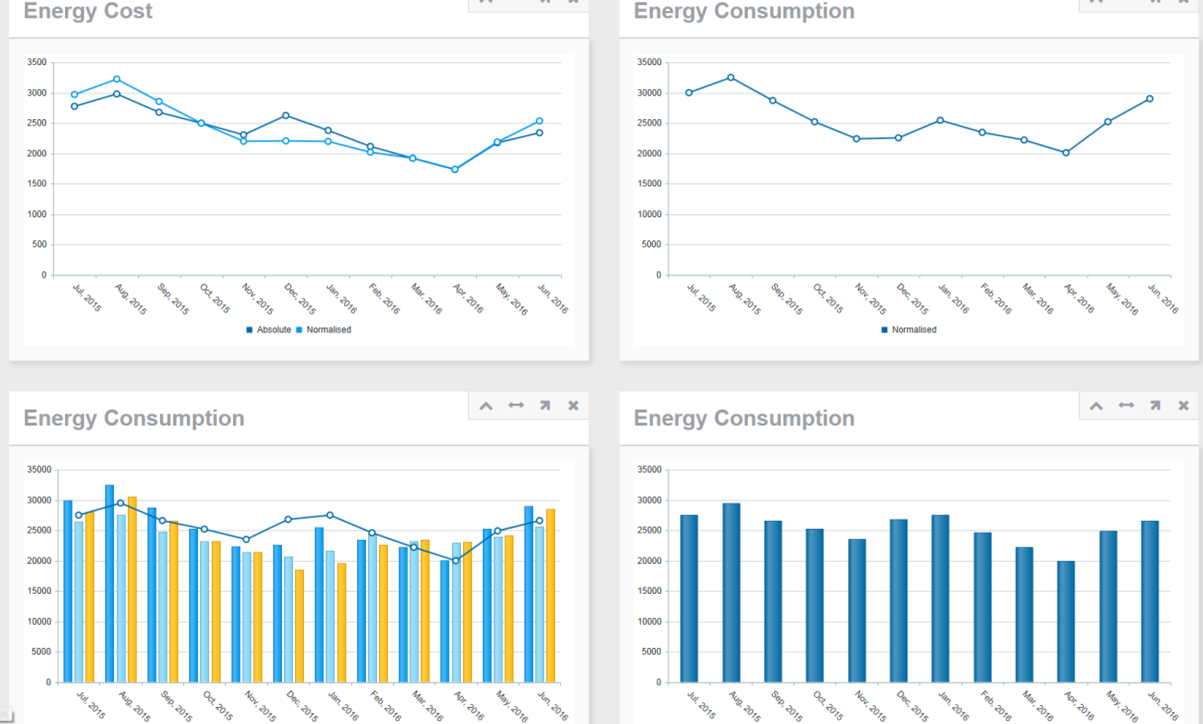
And lastly, the user has the ability to save and to view as on demand reports.
Dashboard
The energy dashboard displays all live data currently on the site based on the latest import.
The RAG rating display an overview of the overall consumption of Energy, Gas, Water and Electricity. The RAG colours are editable in the RAG admin section.

Water & Energy & Gas & Electricity Performance - [Month], [Year]
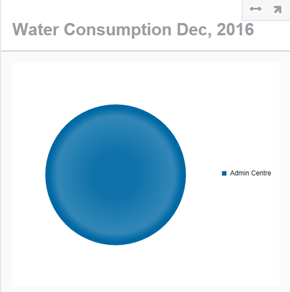
These are individual Graphs of Water, Energy, gas and Electricity displayed by property. Image below used from Water Performance as an example.
Total Energy Consumption
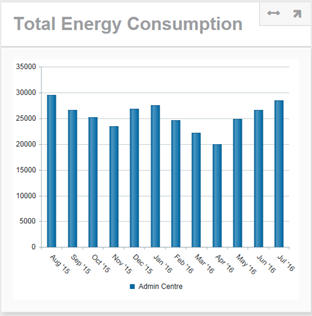
This is a Total Energy Comparison – User can toggle between Admin Centres, Data Centres, and Properties.
Consumption YTD [Year]
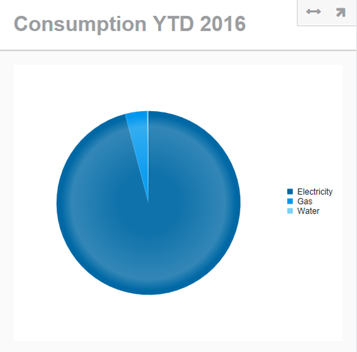
This is a Pie chart tile displaying the Year to Date values for Electricity, Gas and Water. User can toggle between the three data displayed.
Water & Gas & Electricity Consumption YTD [Year]
Year to Date values tile for Electricity, Water and Gas. User can view this at a table format – see below.

Water & Gas & Electricity Consumption YTD [Year]
This is a tile that the user can switch between the Top 10 Properties & Bottom 10 Properties Performance lists. Each type of energy has its own individual tile.

Monthly Reports
Absolute & Normalised Report
This tile displays two reports (Absolute & Normalised) reports – these are reformatted from the spreadsheet report. User can toggle with the Absolute and Normalised data displayed.
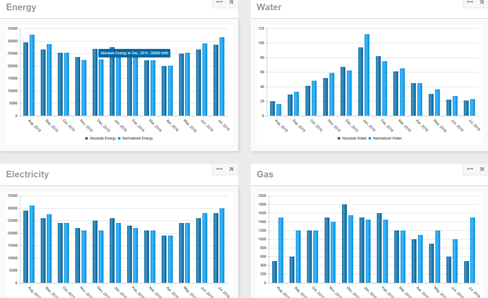
Table Formatted Report
And a table format tile displaying the Energy Report for Admin vs. Data Centres. This compares the current month with last year’s same month.
